The CMCC global ocean forecast system shows the path of Lorenzo before landfall on the Azores Archipelago while the downscaled high-resolution coastal model highlights possible sea level extreme events in Corvo and Flores Islands.
Tropical cyclones are low pressure systems, developing over tropical warm ocean waters, have organized convection and an associated intense cyclonic surface wind circulation. They collect energy from the ocean through the evaporation flux, then from the associated condensation of water in upward air masses near their center. This energy release in the troposphere originates the well-known “warm core”, causing the extraordinary strong winds at the surface. The very strong winds associated to tropical cyclones near the surface cause damage to coastal regions through extreme wind, very intense precipitation and storm surge. Thus, the fundamental role of the ocean in determining Tropical Cyclone activity on the atmospheric component of the climate system merges.
Hurricane Lorenzo broke records when it briefly powered up to a Category 5 on September 28, when it was 2,270 kilometers southwest of the Azores Islands, with winds peaking at 260 km/h. No other tropical cyclone that has formed in the Atlantic has reached such intensity that far northeast since record-keeping began in 1851.
Now weakened to a Category 2 with winds of 165 km/h, Lorenzo hurtled toward the Azores Islands today on October 2 in the early morning.
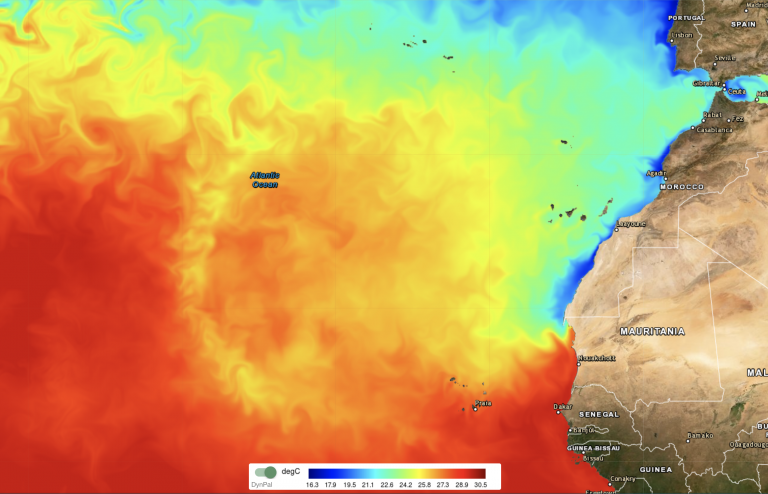
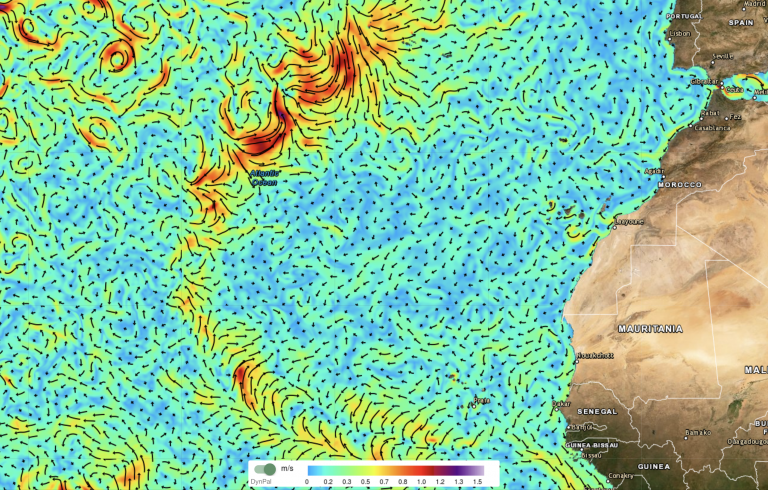
CMCC researchers described Lorenzo’s interactions with the ocean surface properties, analysing the CMCC global ocean forecasting system (GOFS), with a horizontal resolution of 6km. Figures 1 and 2 of sea surface temperature and currents, as forecasted by the GOFS for Wednesday 2 October (12:00 UTC), clearly show the path of the hurricane while moving towards the Azores Islands. The impact on the ocean persists well after Lorenzo has moved away from the region.
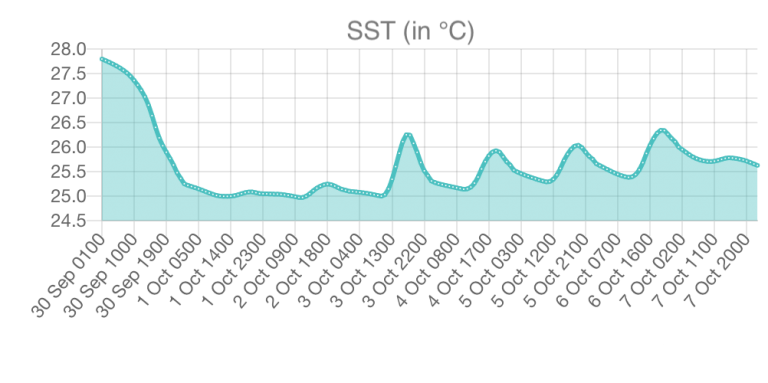
The time series (Figure 3) shows the cooling in the sea surface temperature associated to the passage of Lorenzo (in the North Atlantic ocean at 29.32N, 42.28W).
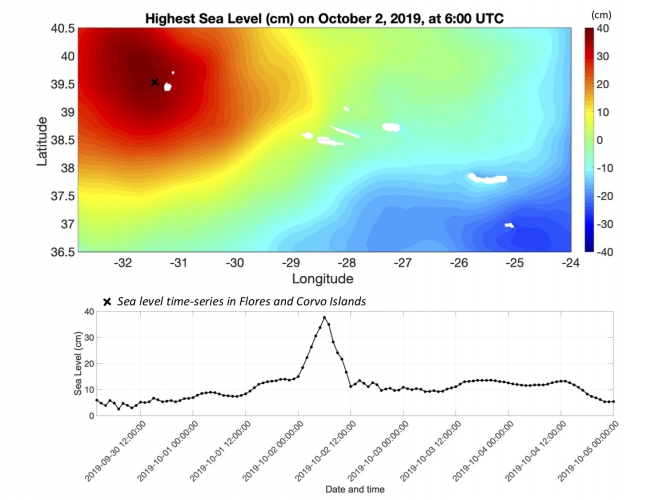
Furthermore, the high-resolution unstructured-grid regional-coastal model (up to 500m horizontal resolution at coasts), developed by CMCC researchers, adopting a downscaling approach from global forecasting products of Copernicus Marine Service, highlights the impact of hurricane Lorenzo in sea level fields. The highest value of sea level was forecasted in Corvo and Flores Islands on October 2, 2019, at 6:00 UTC, as reported in Figure 4 both in terms of sea level map and time series at 39.49N, 31.40W.
Hurricanes draw their energy supply from the ocean heat; high values of ocean heat content have proven useful for identifying ocean regions, particularly favorable for hurricane intensification. Therefore, a proper representation and forecast of the interaction between the hurricane and the underlying ocean is key to determine the potential intensification or weakening of the hurricane. CMCC results underline the relevance of ocean forecast (from global to regional to coastal scales) in predicting hurricane intensity and direction, while supporting atmospheric forecasts.
CMCC researchers that contributed to the realization of these cutting edge ocean forecasts are: Dorotea Iovino, CMCC researcher at ODA Division, where she coordinates the “Ocean and Sea Ice Modeling” group, Ivan Federico, CMCC researcher at OPA Division, Andrea Cipollone, CMCC researcher at ODA Division, where he coordinates the “Data Assimilation” group, Simona Masina, ODA Division Director, Giovanni Coppini, OPA Division Director, and Enrico Scoccimarro, CMCC researcher at CSP Division.
Credits: NOAA NWS National Hurricane Center